Lou Adams Studio · Native Mac software
Signalbook: data, calculations & AI agentic workflow
Signalbook is a native Mac application used for stock research. Deterministic calculations rank eligible companies on profitability, value and momentum. A separate AI news pipeline collects company context, classifies relevance, drafts cited briefings and reviews them against the original evidence.
For screenshots and navigation, see the Signalbook user guide.
Data sources and snapshot flow
The market-data path produces a completed local snapshot that the interface can read offline. News has its own collection schedule, persistent jobs and publication records.
| Source | Used for | Treatment |
|---|---|---|
| FMP market and financial data | Prices, capitalization, statements, ratios, corporate actions and fund metadata | Cached locally; daily price histories and dividend-adjusted histories remain distinct. |
| SEC submissions and Company Facts | Issuer identity, SIC classification, accounting periods, common equity, earnings and cash-flow evidence | Corroborate supported inputs; retain missing-data reasons when evidence is incomplete. |
| Nasdaq public listing directories | Security-type checks before common-equity universe selection | Exclude preferred shares, debt, warrants, units and other ineligible listings. |
| FMP news, releases and profiles | Company context for the separate news pipeline | Save original excerpts before relevance classification, drafting and review. |
From provider records to a completed snapshot
- Load the existing snapshot. The app opens the last completed local database. A local reload reads saved data without requesting new provider data.
- Refresh when requested. A manual market update reuses cached records and usually fetches the recent price-history tail. Overlapping records are checked for changes; full-history reconciliation handles revisions.
- Validate sessions and accounting evidence. Forming daily rows are excluded. Intraday bars must agree with the completed session; incomplete or mismatched intraday data receives an explicit end-of-day fallback. Accounting checks retain dates and the supporting source evidence.
- Publish safely. Only one update can write to the archive at a time. If an update fails, the previous completed snapshot stays in place, and downloaded data can be reused.
- Calculate and display. Eligible inputs produce issuer-level ranks, peer comparisons and filter metrics. The interface applies the chosen conditions to that snapshot.
The archive, manifests, checksums, source evidence and news records are stored locally outside the application bundle. Provider estimates such as beta and P/E are distinguished from the SEC-supported research calculations.
All five chart horizons and the displayed price end at the same completed close. Charts show price returns; the momentum calculation uses a separate dividend-adjusted series.
Candidate selection and default conditions
Signalbook asks three complementary questions: how much gross profit does the business generate relative to its assets; how much common book equity is available for its market price; and how strongly has its stock performed over a defined historical window? Together, these measures help prioritize profitable businesses with relatively inexpensive shares and stronger past returns.
The production universe starts with the largest 1,000 US-domiciled listed common equities by market capitalization and adds current S&P 500 constituents. Security-type checks remove preferred shares, debt, warrants and similar instruments. Research ranking then excludes finance, insurance and real-estate businesses with SEC SIC codes beginning with 6, along with unknown classifications, because the chosen accounting comparisons are not applied to those issuers.
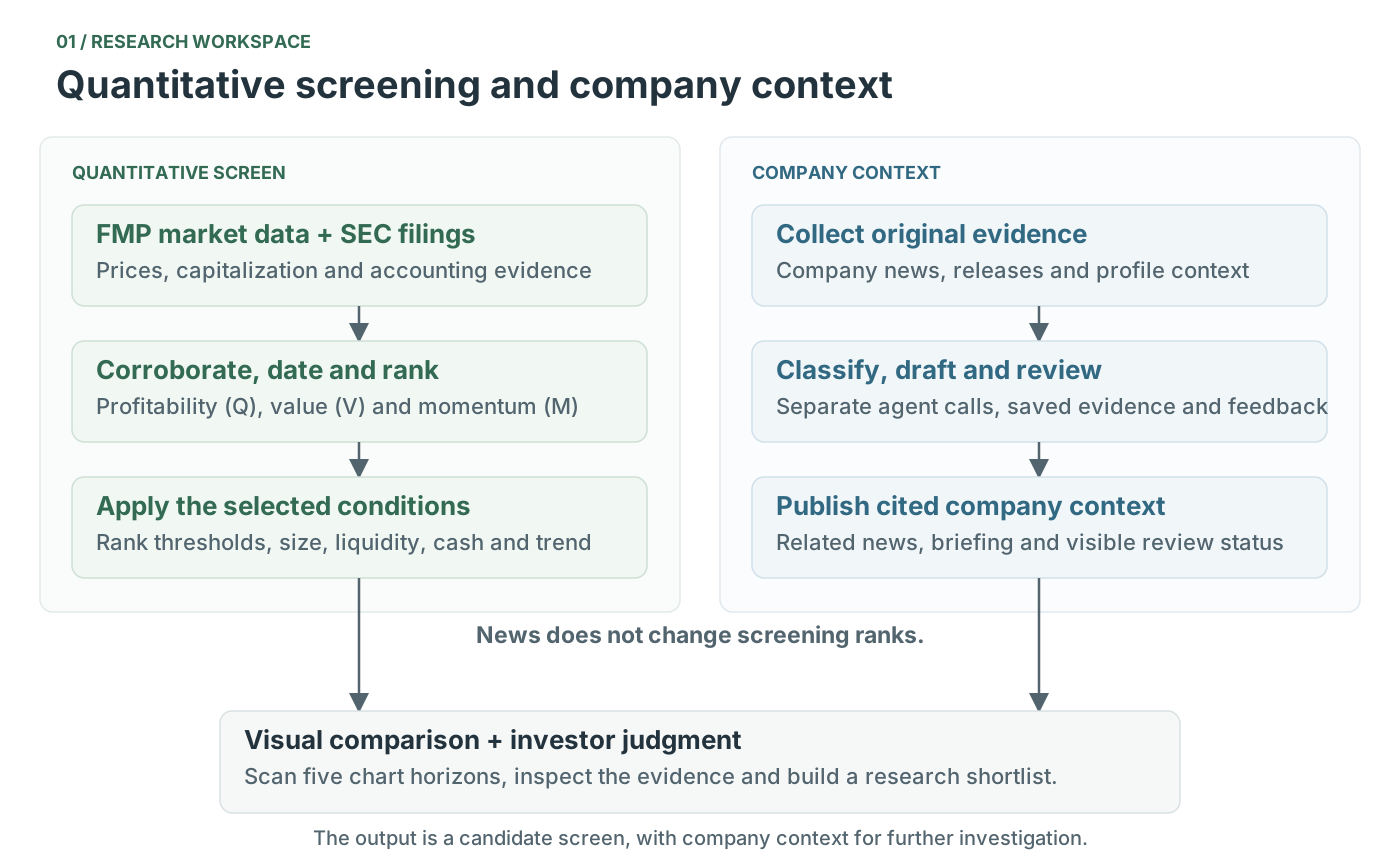
The Promising candidates preset applies the following starting conditions. Every threshold is adjustable.
| Question | Starting requirement |
|---|---|
| Is gross profitability relatively strong? | Q rank ≥ 70 |
| Is book-to-price at least around the middle? | V rank ≥ 50 |
| Is historical momentum at least around the middle? | M rank ≥ 50 |
| Are reported earnings and free cash flow positive? | Both SEC-based trailing measures > 0 |
| Is the company large and liquid enough for this screen? | Market capitalization ≥ $2 billion; average daily trading value ≥ $5 million |
| Is it eligible for these accounting comparisons? | Known SEC classification outside SIC 6 |
| Does the current price meet the selected trend condition? | Latest completed close above both 50- and 200-session moving averages |
Passing companies can be sorted by the average of their Q, V and M ranks. Five charts expose a recent reversal, an uneven advance or differences across horizons, while the news reader supplies company-specific developments and their sources.
The mathematics behind the ranks
The research basis includes Robert Novy-Marx’s analysis of combining gross profitability, book-to-price and momentum, and Kenneth French’s documented convention of using prior months 2–12 for momentum. Signalbook adapts these ideas to its available data and current screening workflow. [1] [2]
Q: gross profitability
qi = annual gross profiti / fiscal-year-end total assetsi
A higher value means that the company produces more gross profit per dollar of assets. The accounting evidence must support a comparable annual gross-profit subtotal. If a direct SEC subtotal is unavailable, a matched-period revenue-minus-cost calculation is accepted only when it also reconciles to the provider record. Ambiguous or unsupported inputs remain unranked.
V: common book equity relative to market value
vi = positive common book equityi / dated company market capitalizationi
Higher book-to-price means more reported common equity for each dollar of market value. Common equity must be supported by SEC evidence, either directly or through an appropriate reconciliation that accounts for preferred equity. Missing preferred-equity information is not silently treated as zero.
The current implementation uses dated current capitalization with lagged annual accounts. It lacks the Compustat deferred-tax and investment-credit adjustments used in the research definition, so this is a book-to-price proxy.
M: momentum, with the latest month skipped
mi = adjusted pricei, end / adjusted pricei, start − 1
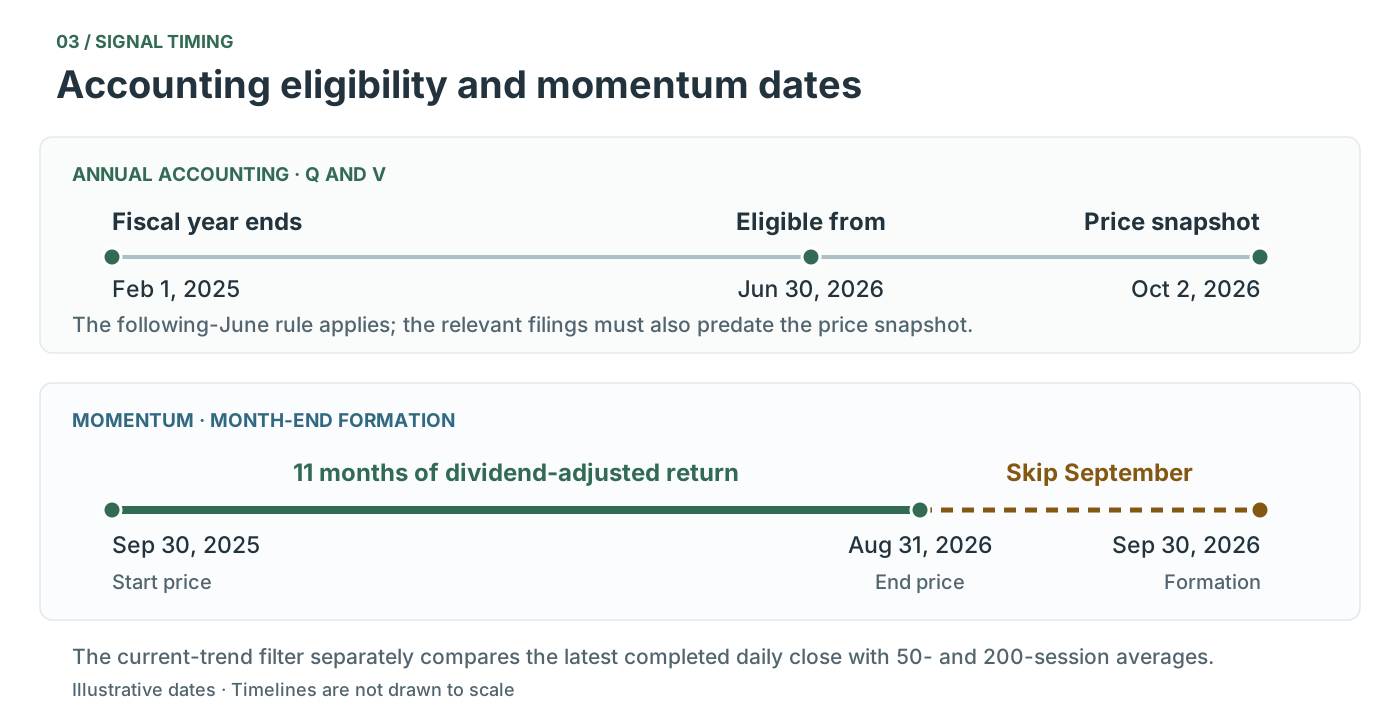
The window is set at a completed month-end. Its start is twelve months before formation and its end is one month before formation, leaving out the latest month. For a September 30, 2026 formation, the example window runs from September 30, 2025 through August 31, 2026; September 2026 is skipped. The calculation uses the separate dividend-adjusted price series, with trading-date and history-completeness checks.
Momentum captures the accumulated return between two dates. It cannot distinguish a smooth advance from a jagged path with the same endpoints. The five charts and the trend filter show what this single number can’t.
Timing is part of the calculation
Annual accounts become eligible on June 30 of the calendar year following the year in which the fiscal period ended, and the relevant filings must predate the price snapshot. A fiscal year ending February 1, 2025 therefore becomes eligible on June 30, 2026. This deliberately retains the research-oriented accounting lag; the latest quarterly report does not automatically replace it.
Convert each measure into a comparable rank
Each measure is ranked among valid, eligible, unique issuers in the loaded database, before the user’s filters. CIK issuer identity prevents multiple share classes from receiving extra weight in the reference population. Because inputs can be missing, Q, V and M can have different population sizes.
R(x) = round[100 × (L(x) + 0.5 × E(x)) / N]
Here, L(x) is the number of reference values below x, E(x) is the number equal to it and N is the reference population size. Ties use their midpoint; at least two valid issuers are required. A rank of 80 indicates roughly the top 20% on that measure.
SQVM = (Q + V + M) / 3
The combined score requires all three component ranks. Q + V mode averages those two instead. A missing input remains missing rather than becoming zero or receiving a guessed replacement.
Supporting filters answer separate questions
- Trailing earnings and free cash flow
- For a supported, aligned reporting period, TTM = latest fiscal-year total + current year-to-date total − comparable prior-year-to-date total. Free cash flow is operating cash flow less capital expenditure. Missing periods or spending remain missing. Reported non-recurring items are included; this is not a normalized-earnings estimate.
- Current trend
- SMAn = the sum of the latest n completed-session closes divided by n. The default screen requires the latest completed close to exceed both SMA50 and SMA200. This is an adjustable condition distinct from M.
- Trading liquidity
- Average daily trading value = the mean of daily close × share volume over the latest 20 completed sessions. The preset requires at least $5 million per day.
- Industry-relative P/E
- The company’s P/E is divided by the median P/E of its profitable industry peer issuers. At least two other profitable peers are required; fewer than ten is marked “thin.” The broader peer reference extends beyond the displayed stock universe. P/E and beta remain provider estimates, rather than SEC-verified research ranks.
A worked example
Consider a hypothetical eligible company with Q = 90, V = 60 and M = 75. Its combined score is (90 + 60 + 75) / 3 = 75. If it also has an $8 billion market capitalization, $20 million of average daily trading value, positive trailing earnings and free cash flow, and a completed close above both moving averages, it passes the starting screen.
If its market capitalization were only $1 billion, it would fail that preset even with the same score. The screen applies every condition; a strong average does not cancel a failed requirement.
Some company-specific accounting items aren’t in SEC’s standard dataset. When that happens, Signalbook shows why the value is missing instead of guessing. [3]
AI agentic workflow: collection, drafting and review
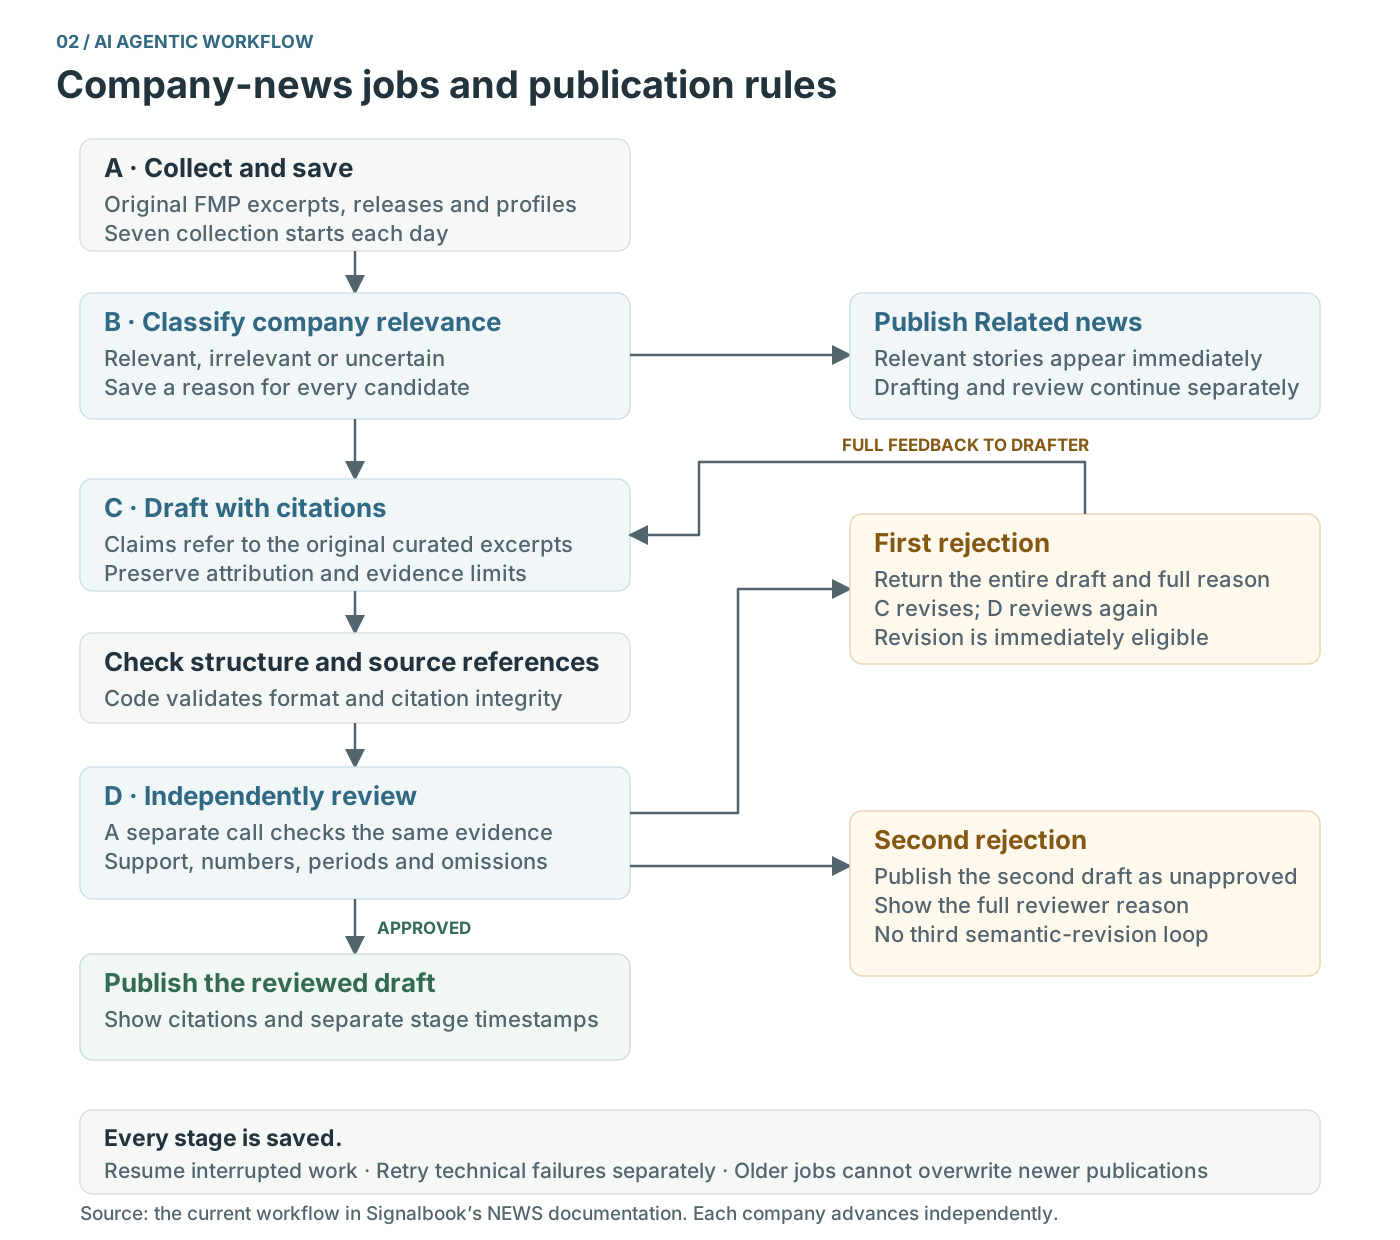
The company-news system separates collection, relevance classification, drafting and independent review. Each company moves through persistent queues, so collection can continue while earlier stories are being analyzed. The selected company and visible rows receive priority, and a slow company does not hold up every other company.
| Stage | Executor | Concurrency | Saved result |
|---|---|---|---|
| A · Collection | Swift collector | Up to eight company collections | Original records and collection progress |
| B · Relevance | GPT-6.1-sol, high effort | Two independent single-company workers | Relevant, irrelevant or uncertain, with reasons |
| C · Drafting | GPT-6-astra, high effort | Two independent single-company workers | Cited draft and evidence limitations |
| D · Review | GPT-6-astra, high effort; separate call | Two independent single-company workers | Decision and full review feedback |
“Independent review” means a separate model call with the draft and original evidence. Drafting and review currently use the same model family.
A. Collect and preserve the source material
The collector saves FMP news excerpts, press releases and company profiles. Scheduled collection begins at 5:00 am, 8:30 am, 10:00 am, noon, 3:00 pm, 6:00 pm and 9:00 pm New York time, every day. Those are collection start times; downstream queues run continuously. Collection continues in the background while the app is closed, as long as you are logged in to your Mac.
B. Decide whether the story concerns the company
The relevance agent receives the company name, ticker, aliases, business context and original candidate records. It classifies each record as relevant, irrelevant or uncertain, with a reason. This catches ambiguous company names and mis-tagged stories that a simple name or ticker match would let through. Relevant stories appear in Related news as soon as classification finishes.
C. Draft a briefing grounded in excerpts
A separate agent summarizes material developments from the relevant original excerpts, attaching source IDs to each claim and identifying evidence limitations. It normally receives relevant material from the last 14 days; if none exists in that window, it uses the latest publication day. A narrow code check validates the company identity, response structure, nonempty claims and valid source references. Semantic support is assessed by the reviewer.
D. Review, revise and make status visible
The reviewer receives the draft and the same immutable evidence. It checks support, numbers, units, periods, attribution, qualifications and important omissions. Approval publishes the briefing immediately. A first rejection sends the complete draft and full feedback back for revision, followed by another independent review.
A second rejection publishes the revised draft as unapproved, with the reviewer’s full reason displayed above it. Formatting errors and failed requests are retried separately and do not consume these two semantic reviews. Briefings are based on provider excerpts, not full articles.
Persistent jobs, retries and publication order
Jobs retain original evidence, classification decisions, drafts, reviews, feedback and their stage. Interrupted work resumes from saved progress. Prompts, responses and run measurements remain available in private audit records. Completed newer generations cannot be overwritten by older jobs that finish late; each briefing retains its own citation snapshot and distinct generation, review and publication times.
Each news agent runs as a separate, restricted model call with no web, browser or system access. Article text is treated as source material, never as instructions. Their role is to contextualize the candidates; they do not calculate Q/V/M, modify ranks or place trades.
Native interface and processing architecture
Signalbook uses Swift 6, SwiftUI controls, AppKit’s NSTableView and Core Graphics. The table reuses visible cells, while cached paths and backing surfaces reduce repeated chart drawing. Ordinary idle charts do not run a continuous animation loop.
Filtering, sorting and data processing run away from the main thread. Updates are applied in batches, and rapid filter changes cancel superseded requests or discard stale results. Row membership and order are updated separately from visible-cell content, preserving selection by company identity.
The GUI and the scheduled news service use the same installed executable and durable local storage. Favorites and named filter presets persist locally; unsaved filter adjustments do not survive a relaunch.
These choices keep the interface fast enough for quick visual scanning with fewer repeated clicks in navigation and screening.
Implementation scope and limitations
Signalbook is a screening and research tool. It doesn’t backtest strategies, connect to a broker, execute trades or size positions, and the research it draws on doesn’t predict its results. Passing a screen is a starting point, not an investment decision.
Current use and availability
Signalbook is currently being used in-house for investment purposes. It is not yet available on app stores.
Research and source references
- Robert Novy-Marx, The Quality Dimension of Value Investing. See “Incorporating Momentum” and Appendix A for the combined measures and variable definitions.
- Kenneth R. French Data Library, Detail for Monthly Momentum Factor (Mom). Documents the prior (2–12) return convention.
- US Securities and Exchange Commission, EDGAR Application Programming Interfaces. Describes submissions, Company Facts and the scope of standard-taxonomy XBRL data.