Lou Adams Studio · Native Mac software
Signalbook user guide
Screenshots and instructions for screening, comparing charts and reading company context.
Signalbook is designed to present promising stocks for quick visual scanning, with fewer repeated mouse clicks in navigation and screening. Five chart horizons remain visible in every row, filters sit above the results, and selecting a company opens its news reader in the same workspace.
For data sources and calculations, see the companion page on data, calculations and the AI agentic workflow.
1. Read the screening workspace
The header selects Stocks, Funds or Shortlist. The count beside that choice is the total loaded universe; the larger count above the table is the number matching the current conditions.
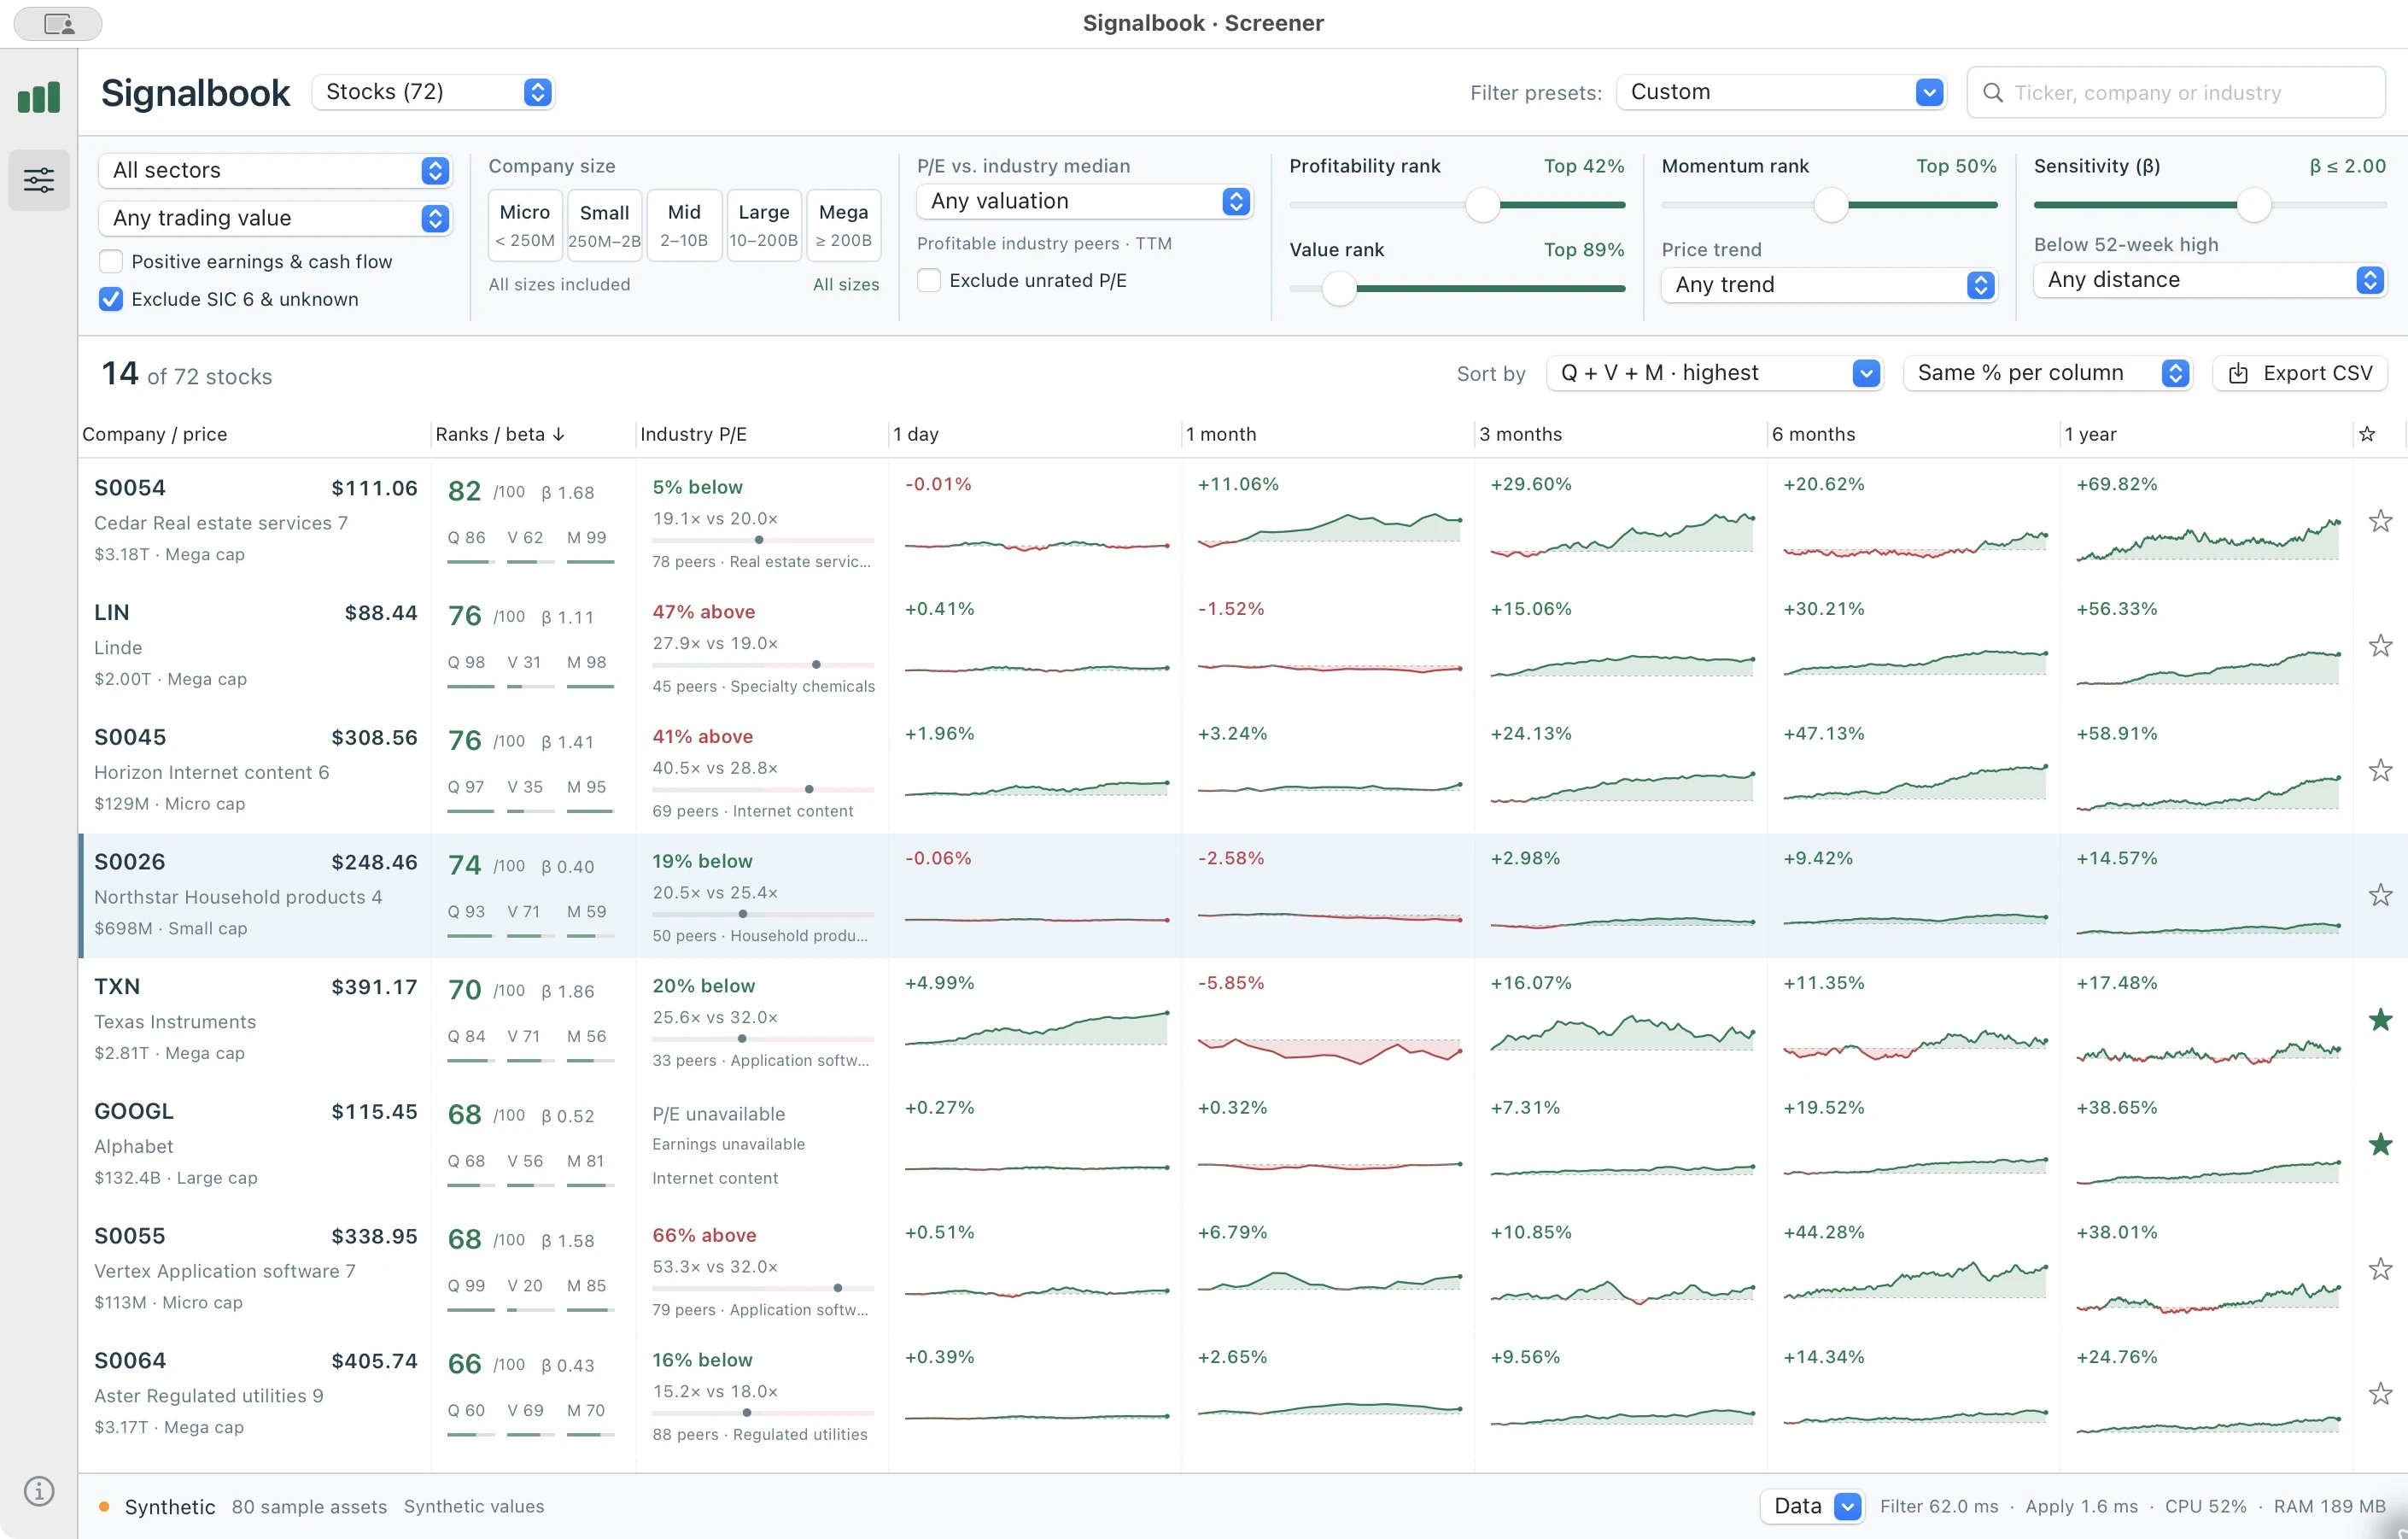
- Company / price: ticker, name, completed-session price and company size.
- Ranks / beta: the chosen combined score, individual Q/V/M ranks and a separate beta estimate.
- Industry P/E: the company’s P/E relative to its profitable industry peers, with missing or thin coverage identified.
- Five charts: 1 day, 1 month, 3 months, 6 months and 1 year, without switching chart tabs.
- Star: add or remove the instrument from the local shortlist.
Use Sort by to change the ranking order. Column headings also sort; clicking a heading again reverses its direction.
2. Adjust and save filters
In Stocks, Filter presets → Promising candidates applies the starting research conditions. All stocks removes those starting conditions. Adjust the controls in place and watch the matching count and rows change.
Every active condition must pass. Selecting several company sizes includes any of those sizes. The rank sliders specify minimum percentiles: Top 30% means rank 70 and above. Their green region fills to the right to show the retained range; the beta control instead represents a maximum. Arrow keys adjust a focused rank slider by one point.
The default conditions and calculation definitions are documented on the system page.
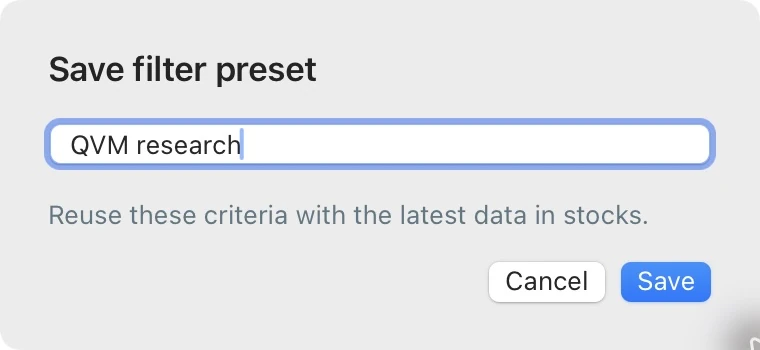
- Set the criteria you want to reuse.
- Choose Filter presets → Save current filters…, enter a name and save.
- Select that name from the preset menu for its asset world in a later session.
Named presets and starred instruments persist on this Mac. Unsaved filter adjustments do not survive an app relaunch.
3. Compare shared and individual chart scales
Same % per column, shown in Screen 1, uses a common percentage range across all matching rows within each horizon. That makes the size of one company’s move comparable with another’s. Different horizons still have their own ranges.
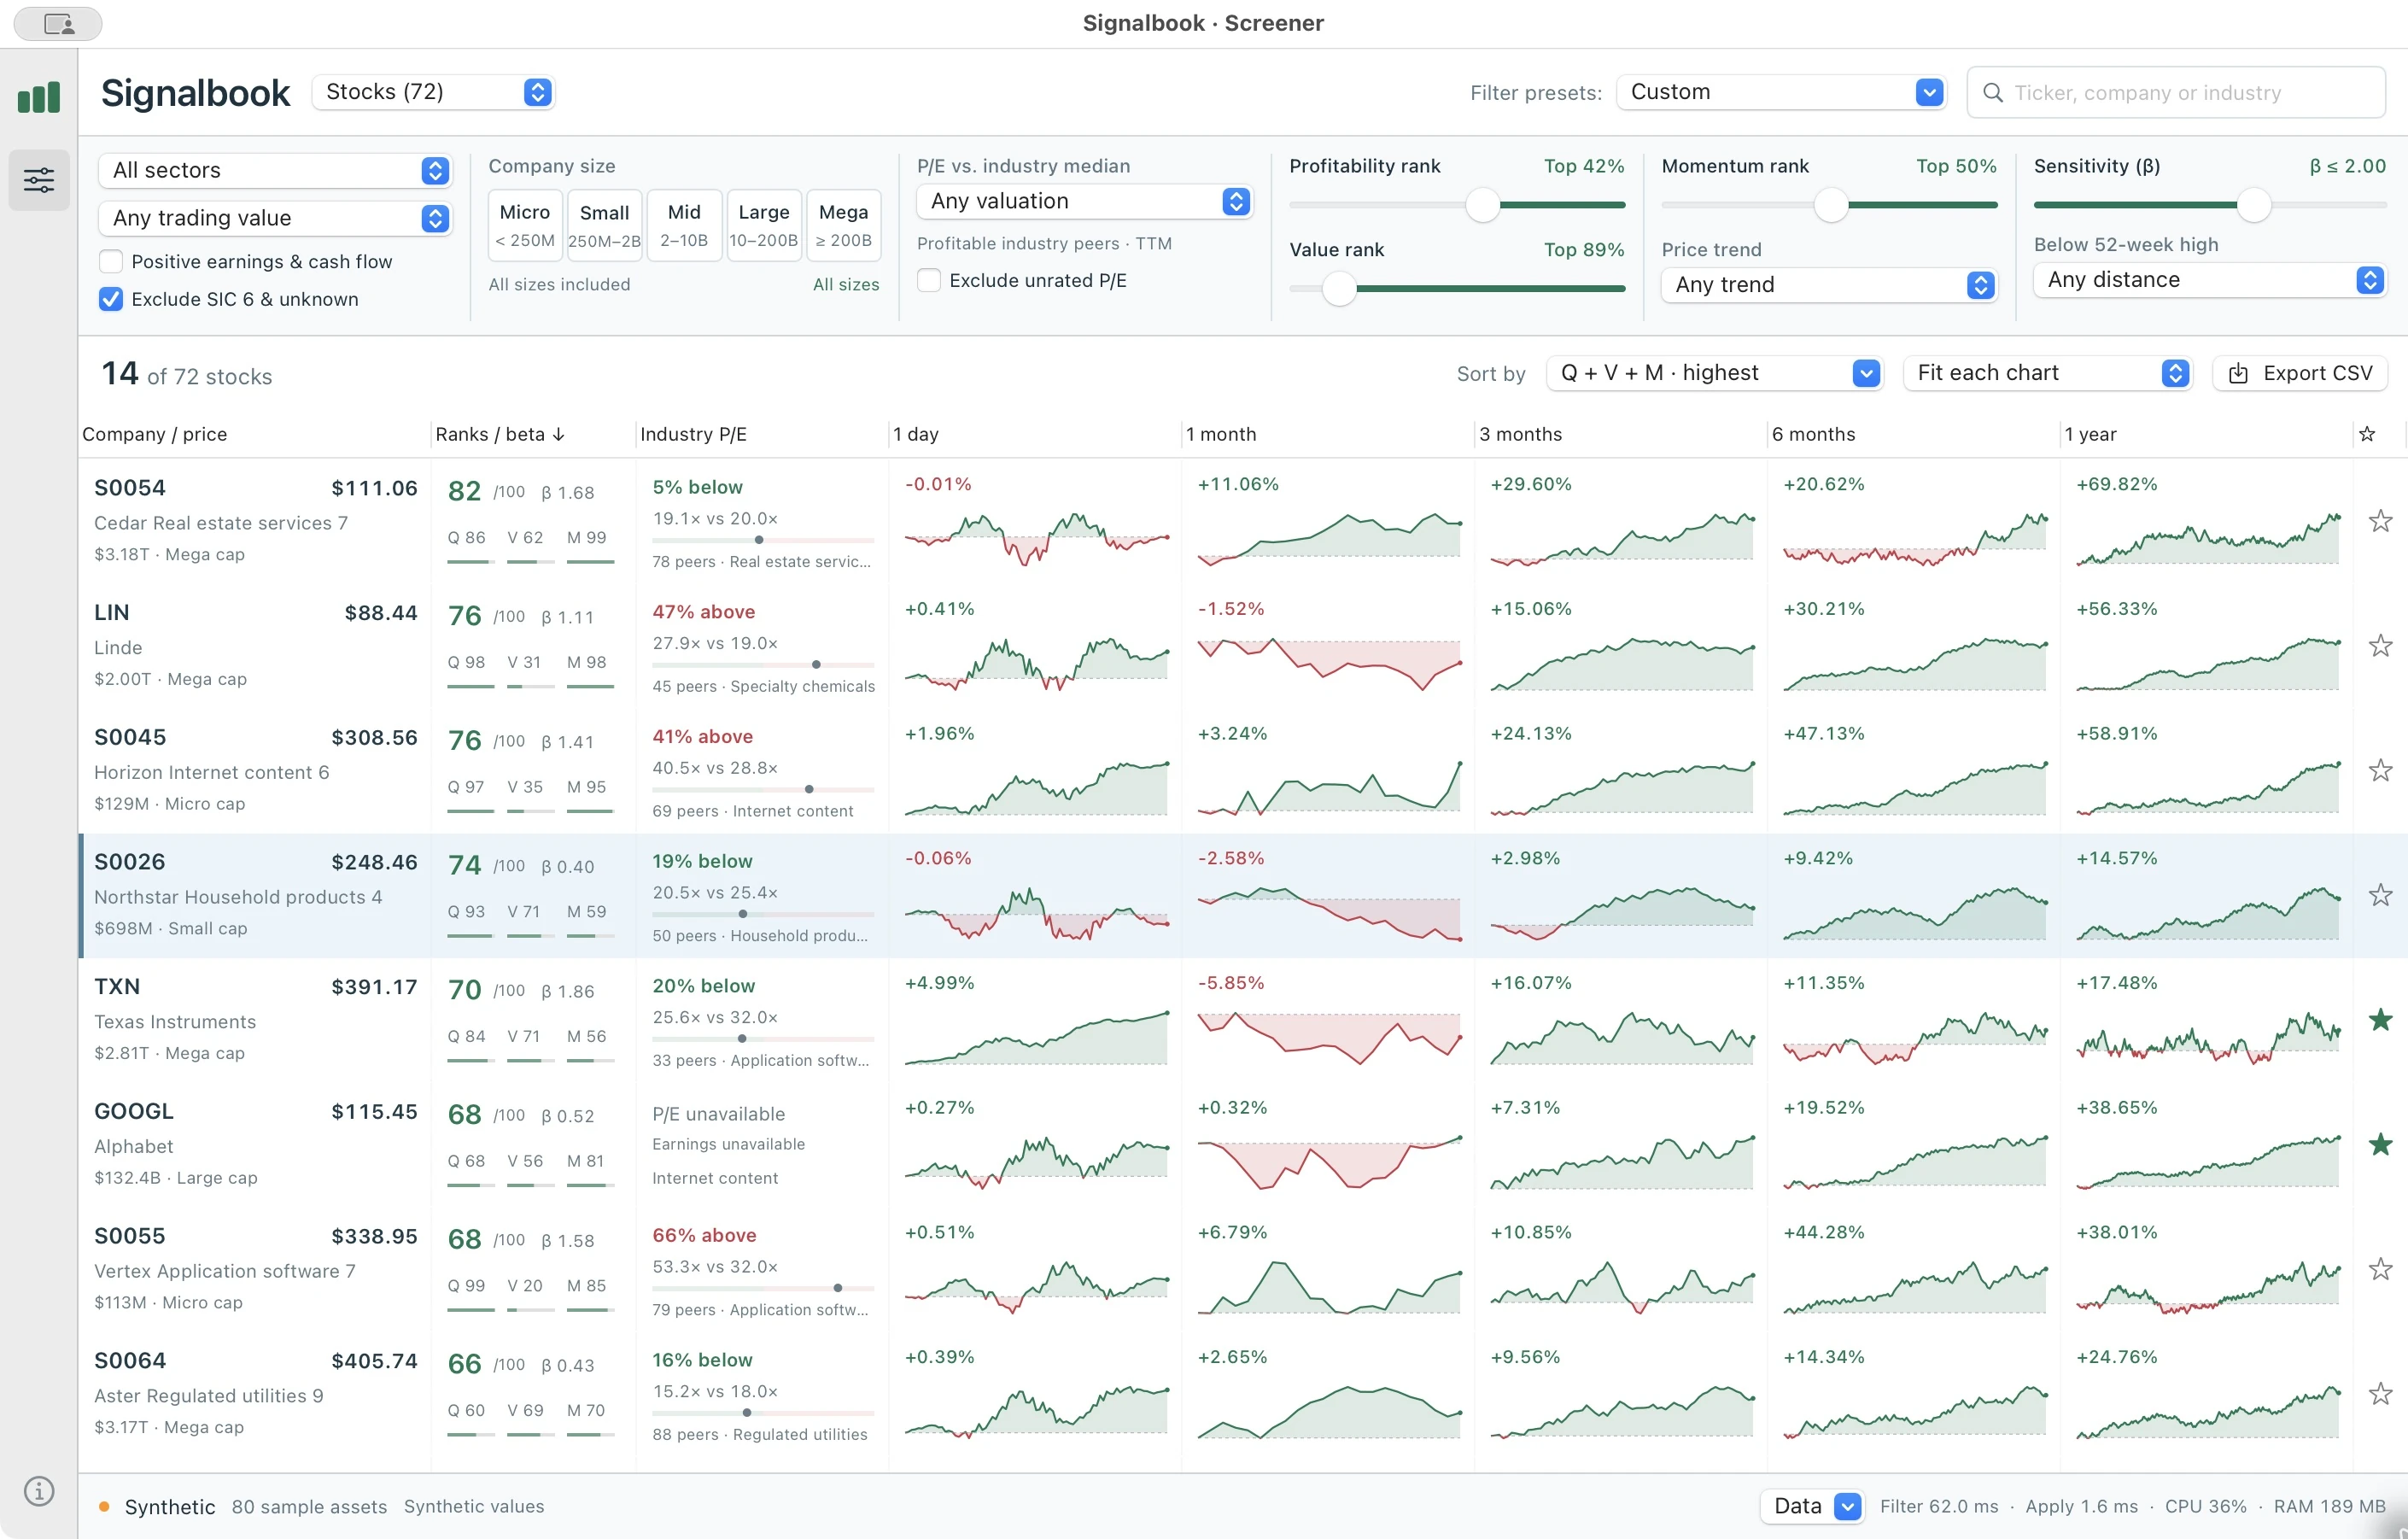
Fit each chart uses each chart’s own range. It reveals the shape of a small move, but the apparent heights no longer compare return magnitudes between companies. Compare the one-day column in Screen 1 with Screen 3 to see the difference.
Green means above that chart’s baseline; red means below it. A downward segment can still be green. The 1-day baseline is the preceding regular-session close, while longer horizons use the period-start close. All horizons end at the same completed close. These charts exclude dividends; the research momentum calculation uses dividend adjustments.
4. Read ranks and check their evidence
Q describes gross profitability relative to assets, V describes common book equity relative to market value, and M describes past dividend-adjusted returns with the latest month skipped. They are relative ranks calculated before the current filters. A rank of 80 means roughly the top 20% on that measure, not an 80% gain or probability of profit.
Hover over a rank to inspect its dates, inputs, reference population and any missing-data explanation. A blank is missing evidence or an inapplicable measure, not a zero. Every required component must exist for a combined score. The production ranks exclude SIC 6 and unknown classifications.
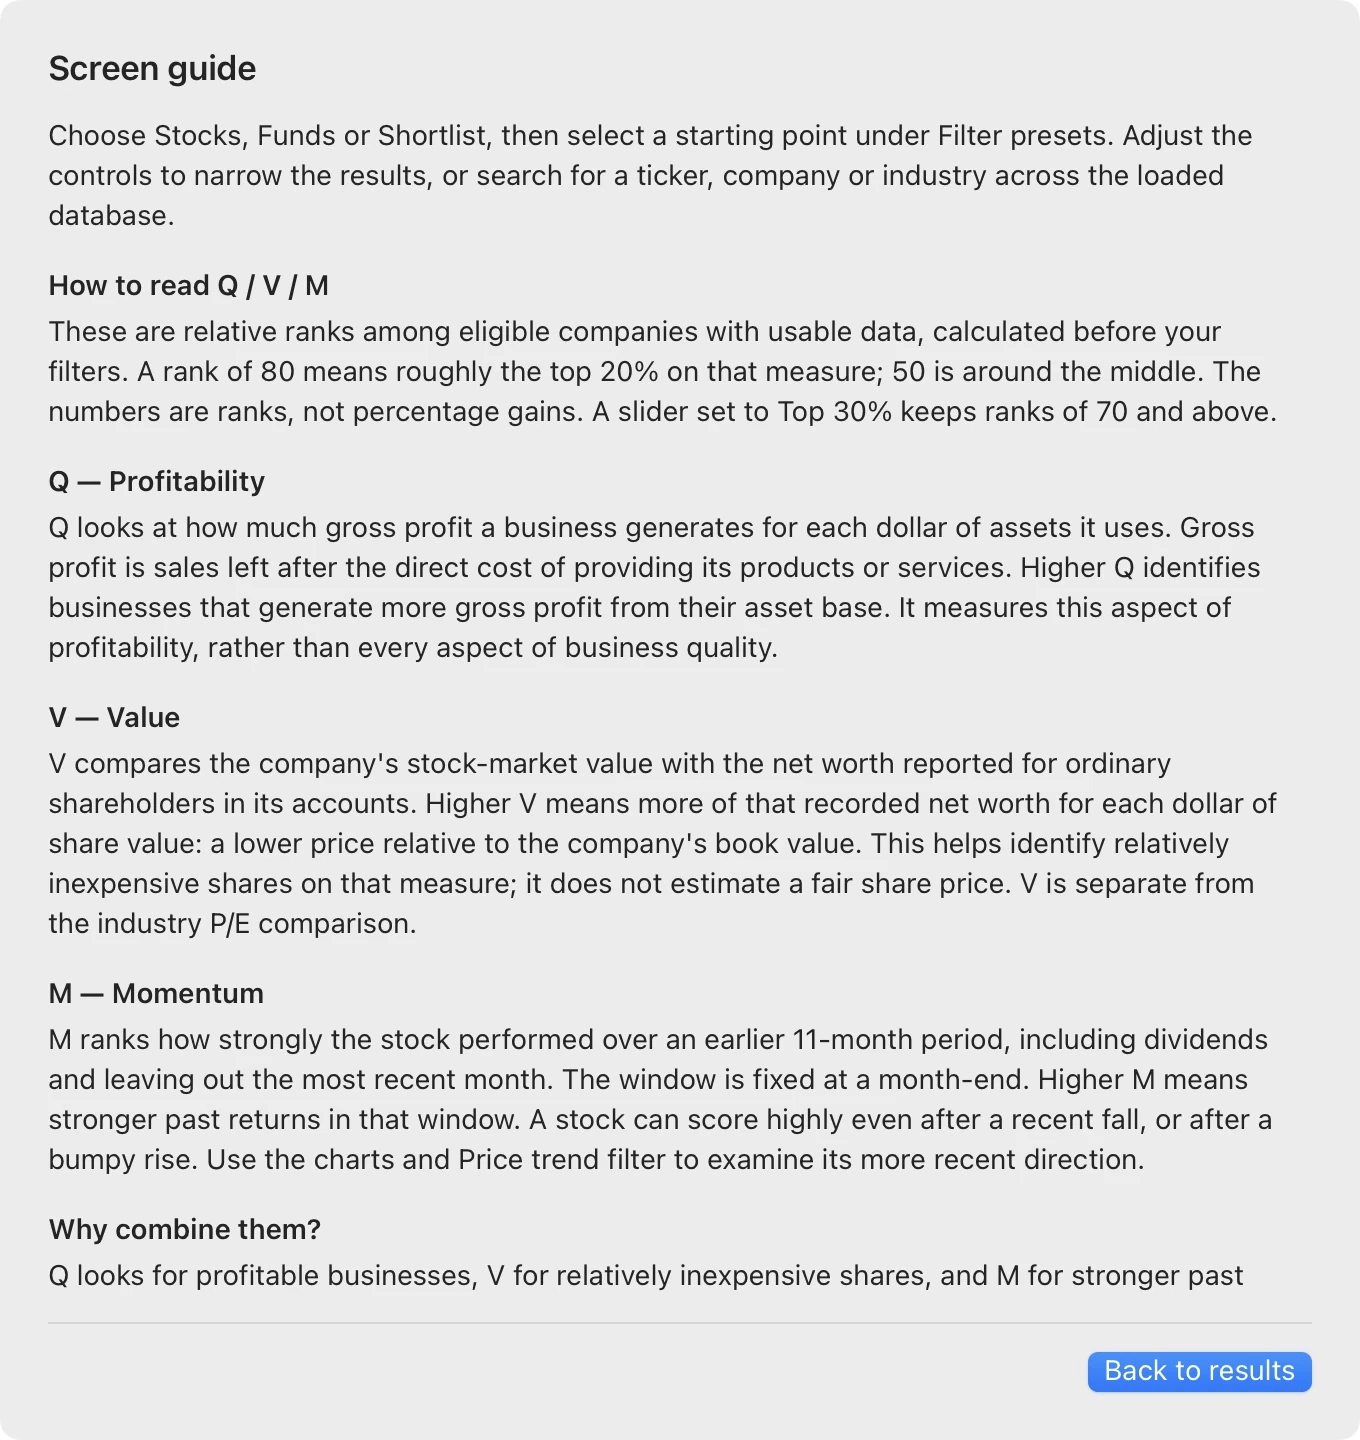
The industry P/E comparison is separate from V. “Thin” identifies fewer than ten profitable peers; at least two other profitable peers are required. Beta and P/E remain provider estimates. For equations, accounting lags and source requirements, see the mathematics behind the ranks.
5. Search across the loaded database
Enter a whole word or phrase from a ticker, company name or industry. Matching is case-insensitive. An exact ticker is placed first by the default Relevance sort, followed by company-name matches and then other matches.
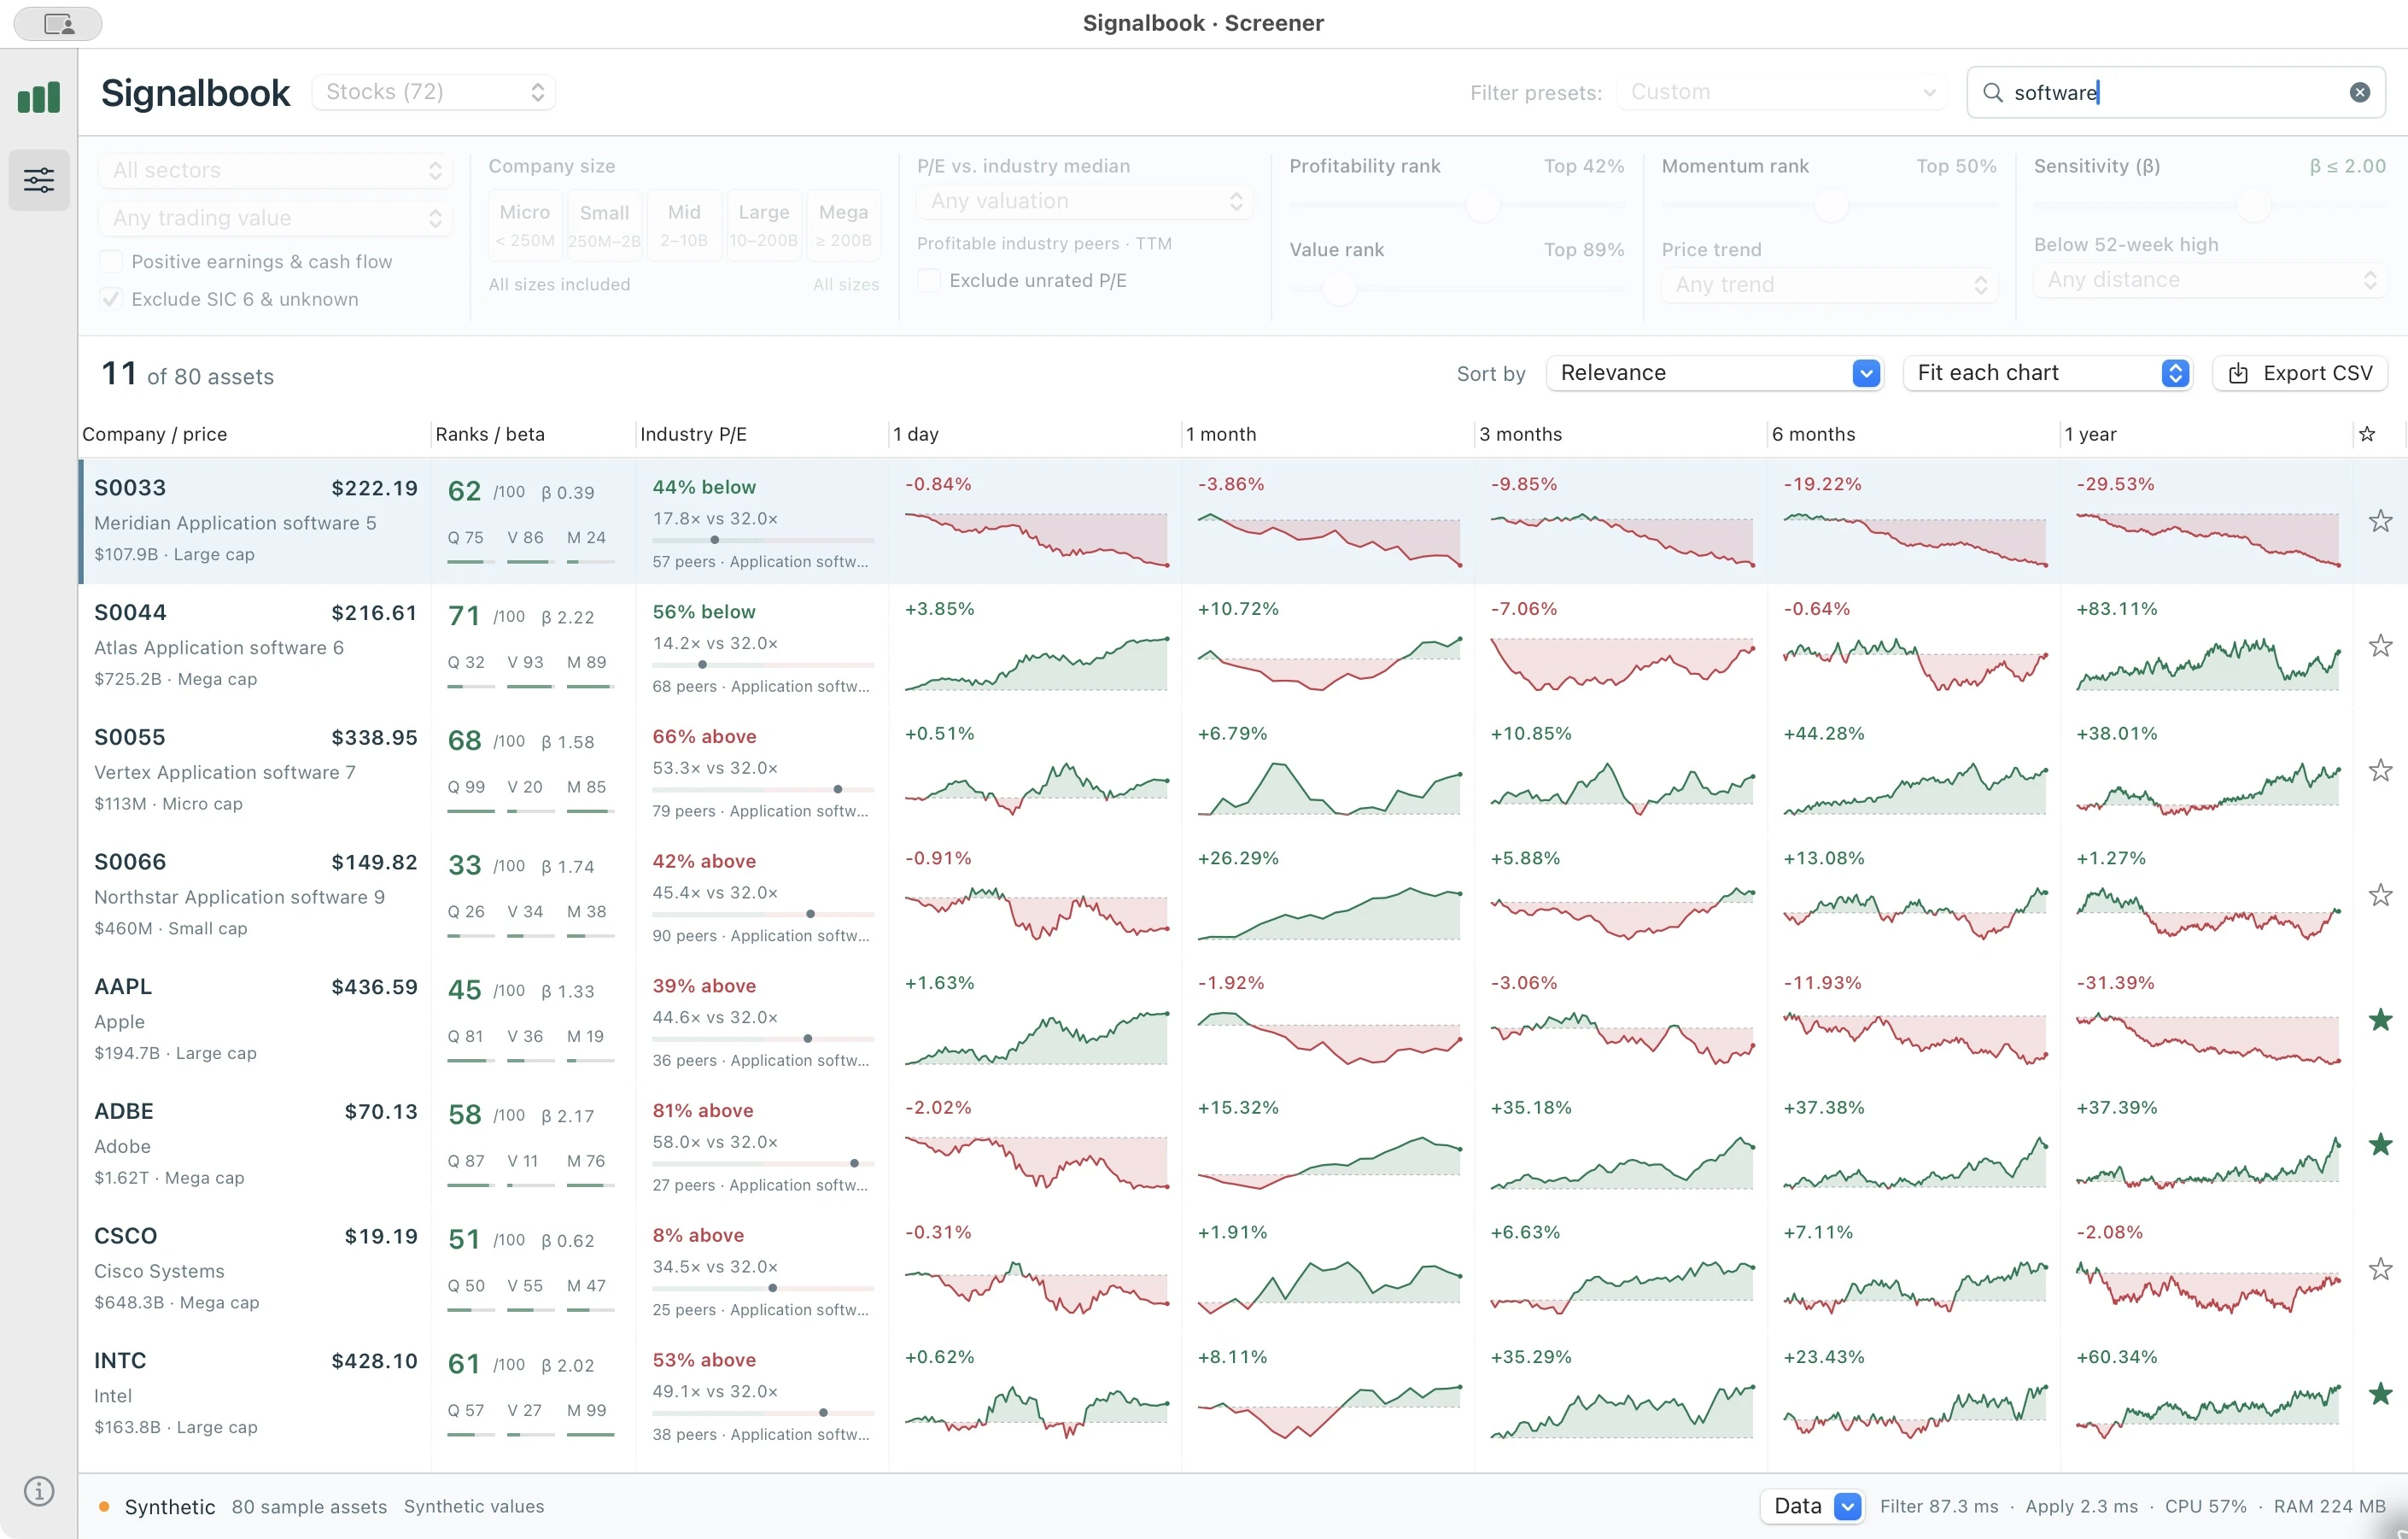
While text is present, search is the only condition determining membership across stocks and funds; the asset selector, presets and screening controls are disabled. Other sorts remain available. Clear the text to restore the prior filters and sort. This makes direct lookup possible without first undoing each screening condition.
6. Browse funds
Choose Funds in the header to view the configured fund universe. The first selector becomes an asset-class selector. Five price charts remain available, while equity-only controls are disabled.
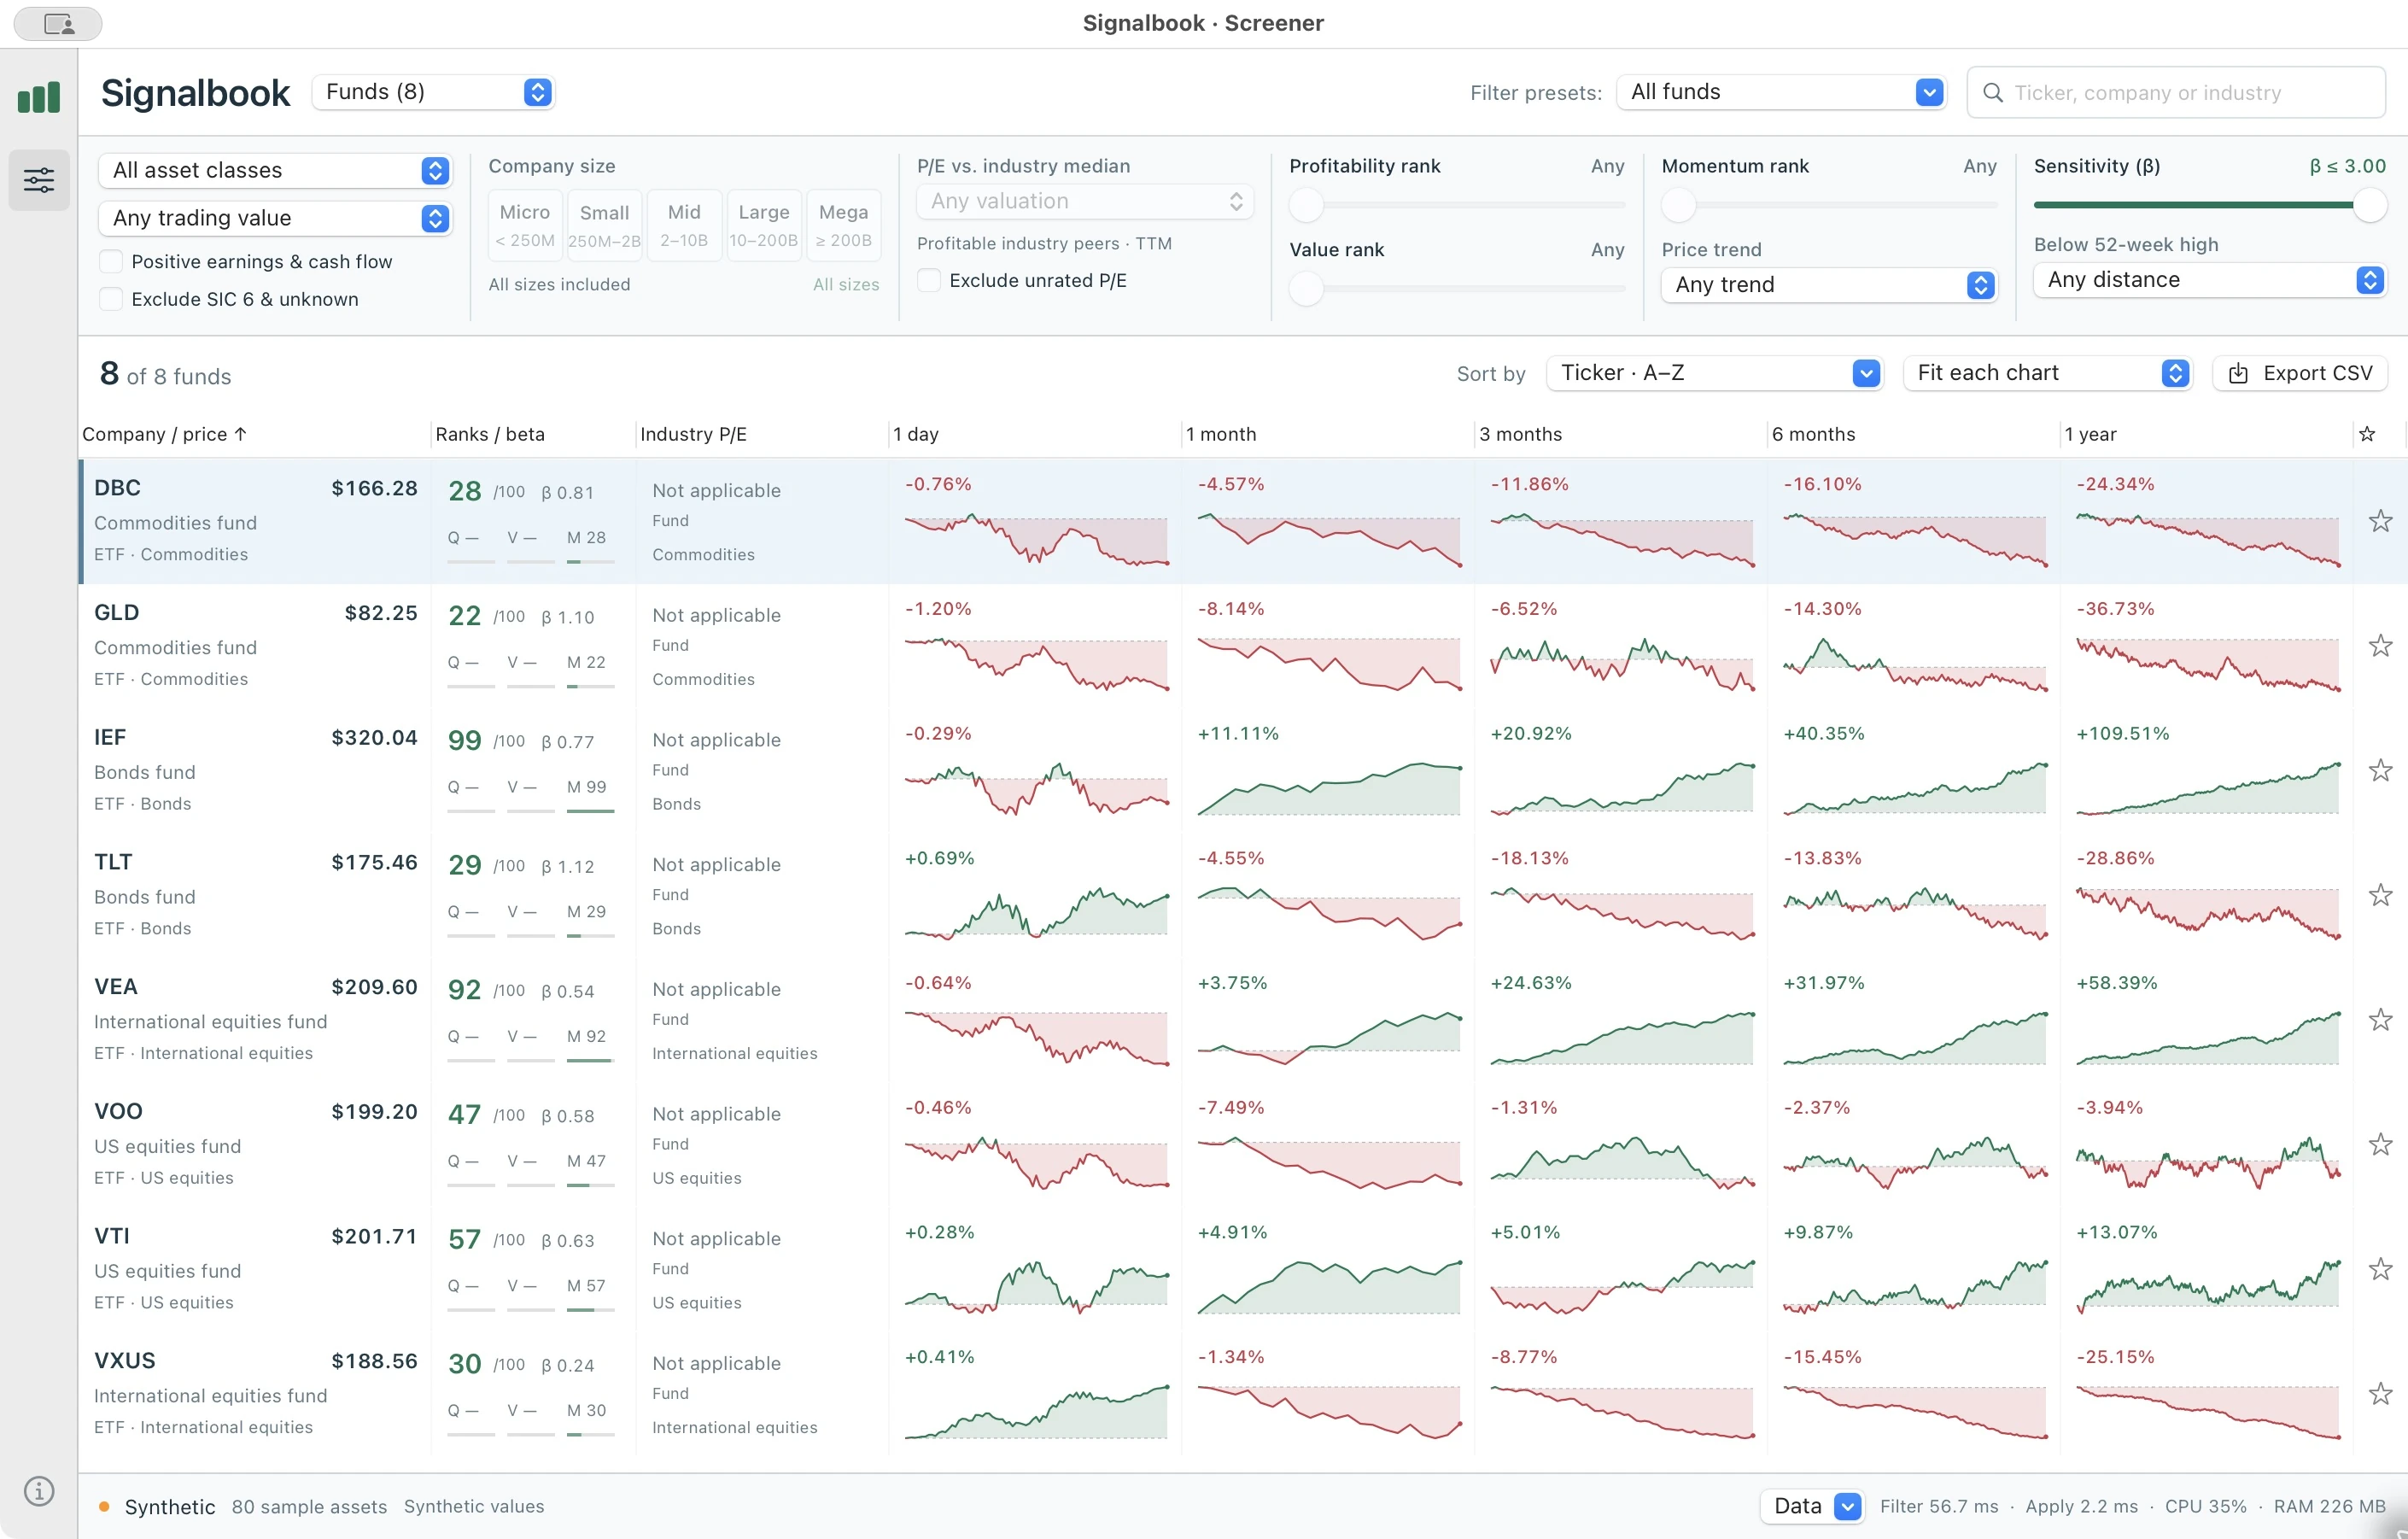
Use the fund charts, trading value, price trend and distance below the high for applicable comparisons.
7. Keep stocks and funds in one shortlist
Click the star at the right of a row to save an instrument. Choose Shortlist in the header to see the saved stocks and funds together. Entering this view clears the screening conditions so all starred instruments are included.
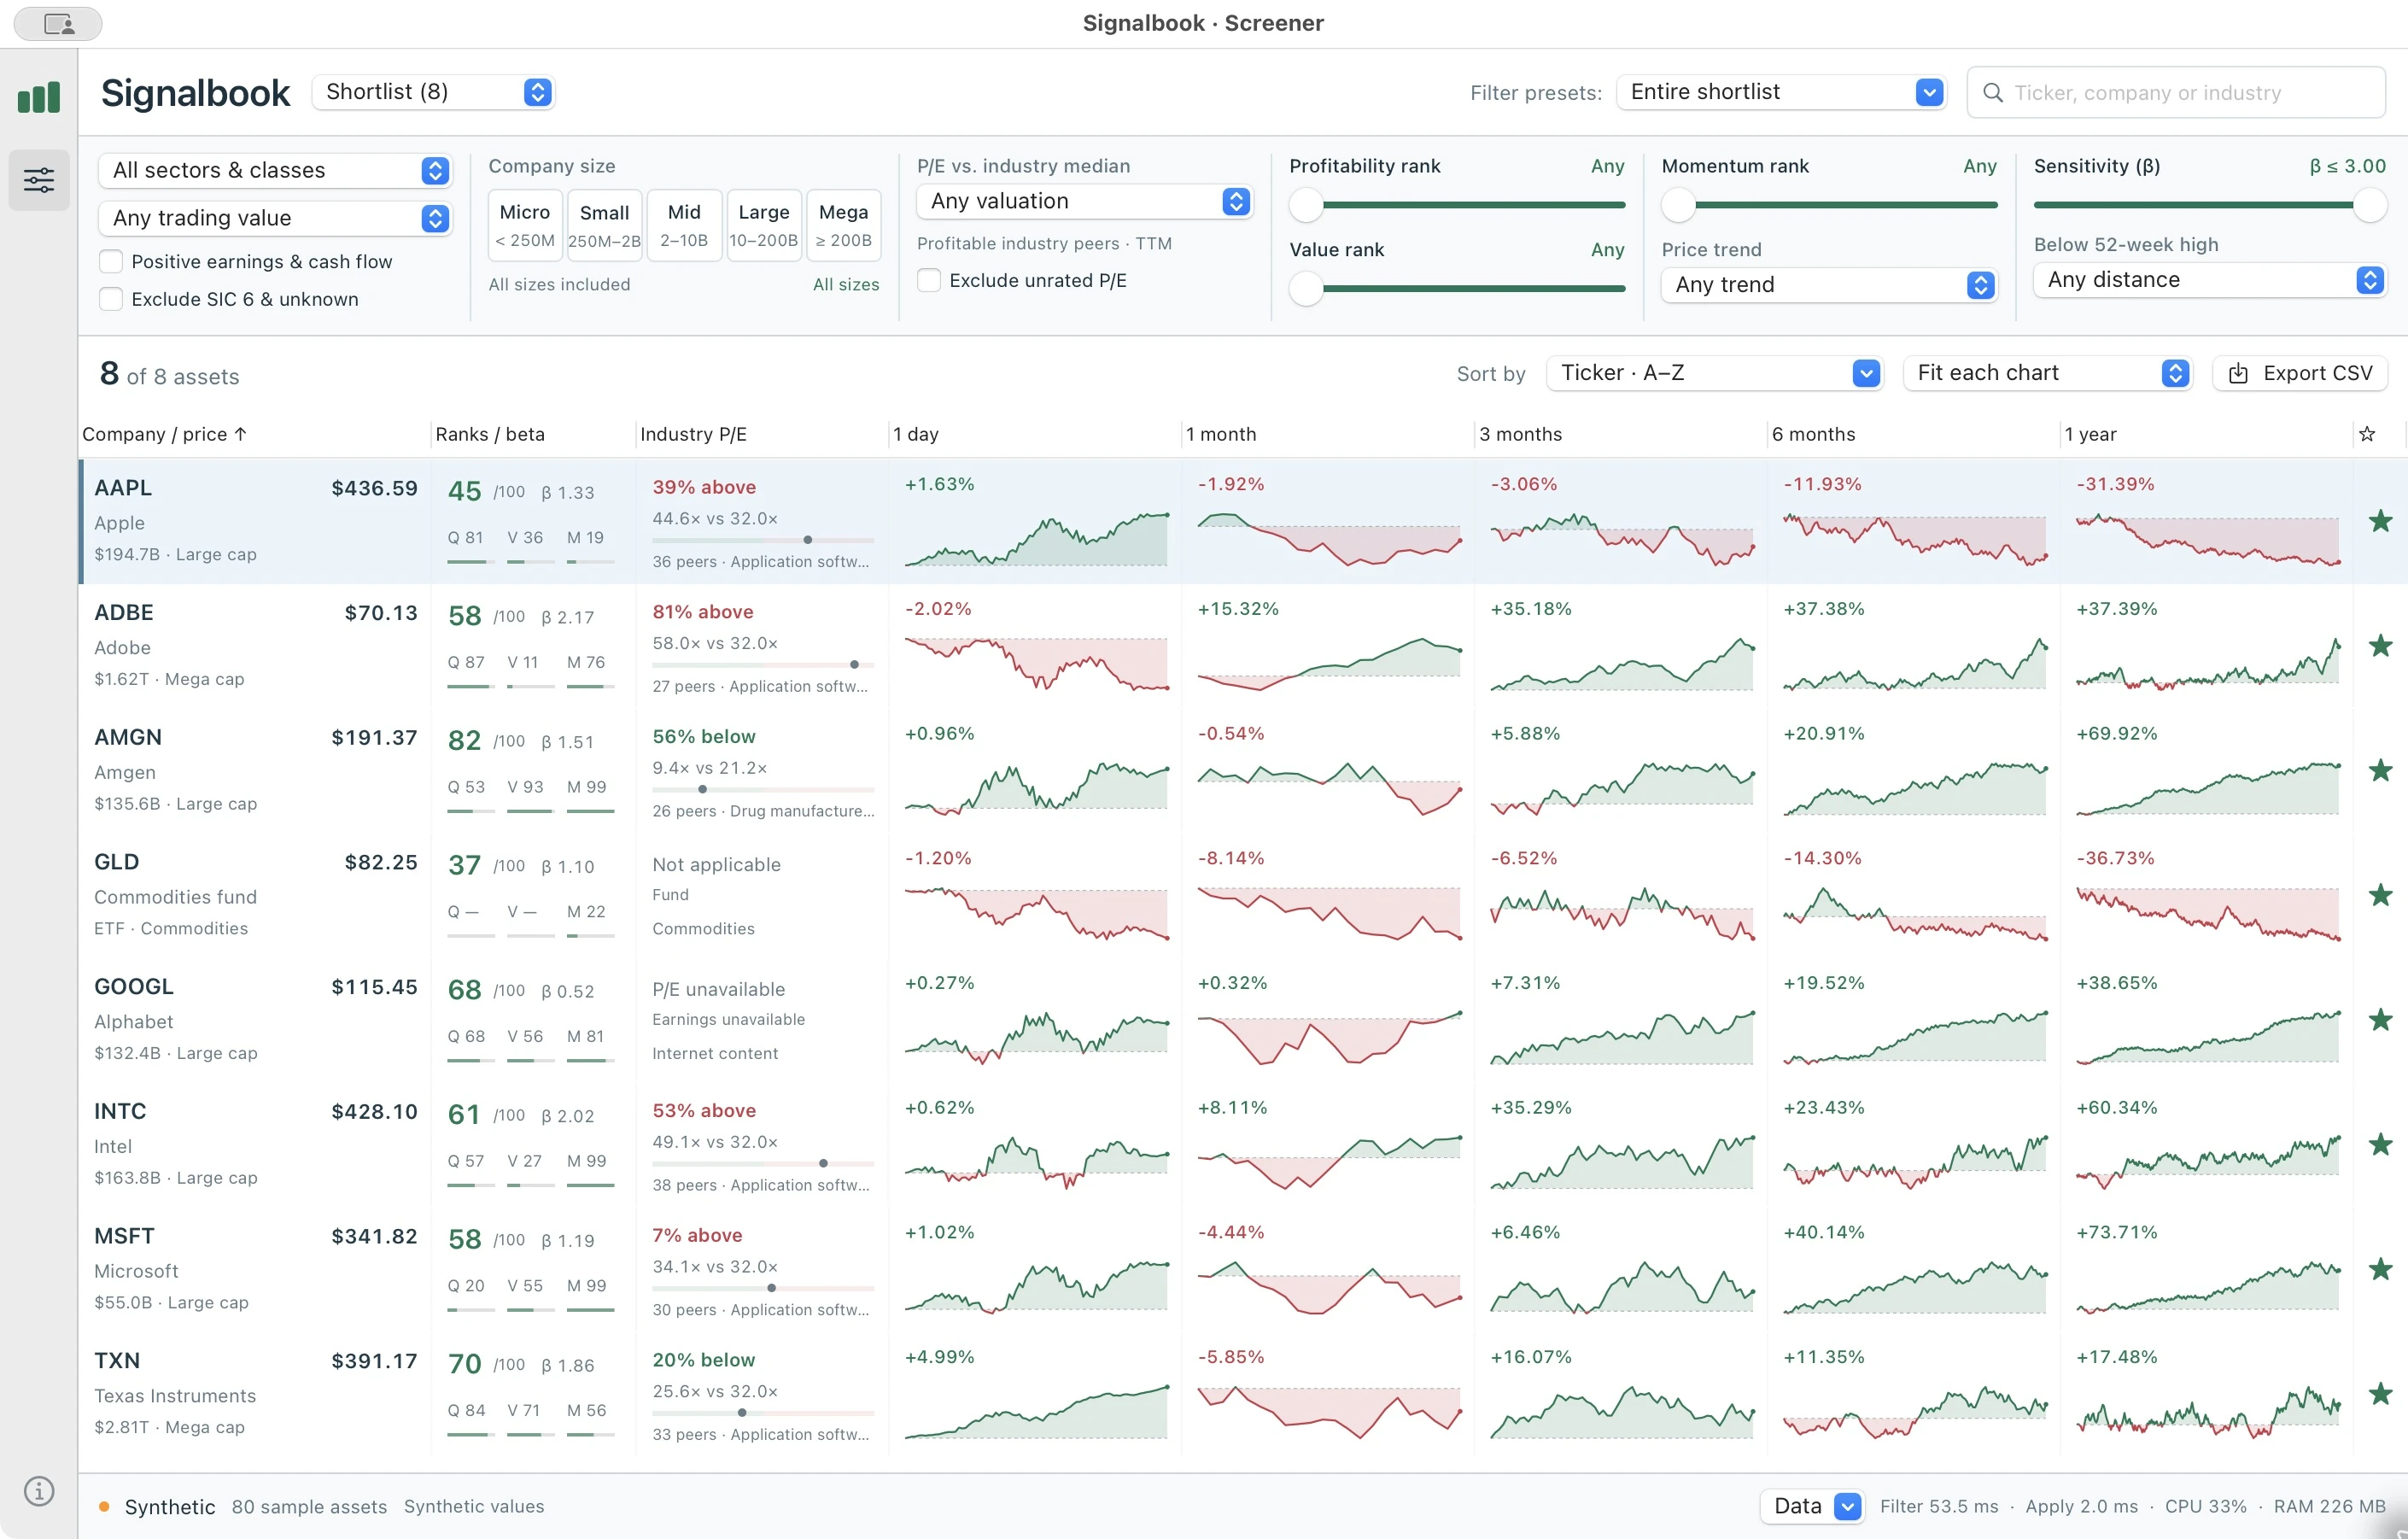
You can then filter or sort the shortlist. Applying an equity-only condition excludes funds from that filtered view. Click a filled star to remove an instrument; starred choices are stored locally.
8. Read the selected company’s news
Click a stock row to open its three-column news reader below the table. The selected company remains visible in the screening workspace. The close button dismisses the reader; clicking the selected row again reopens it.
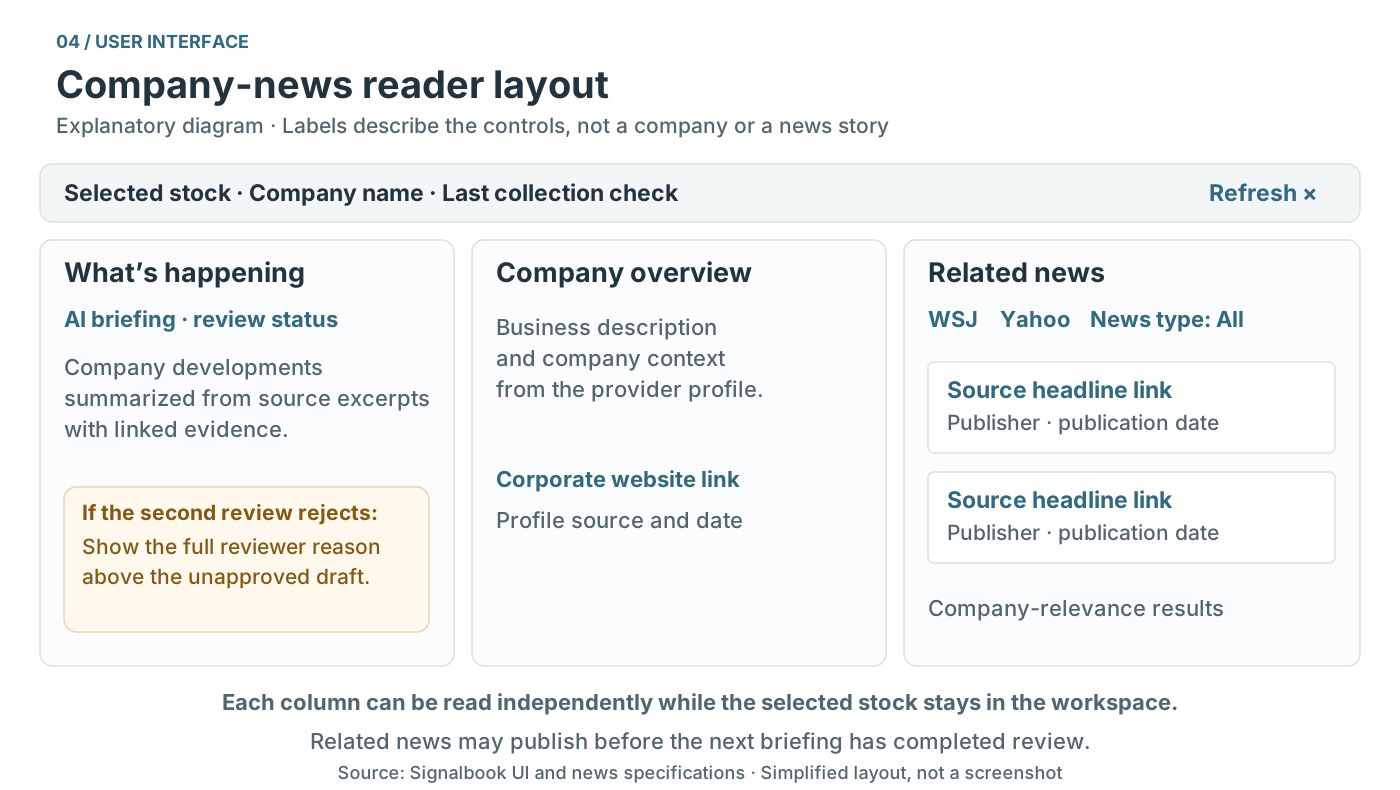
- What’s happening
- The AI briefing presents company developments with source links and review status. An unapproved second draft displays the full reviewer reason above the text. Generated, reviewed and published times describe different stages.
- Company overview
- The company profile provides business context, a corporate website link and the profile source date.
- Related news
- Relevant source headlines carry publisher and date information. WSJ and Yahoo links provide direct company lookups; the news-type selector narrows the displayed records.
Related news can appear before a new briefing is ready. “Checked” describes collection activity, not necessarily a completed new AI review. The refresh control requests company-news work; it does not update market prices. See the AI agentic workflow: collection, drafting and review for the job sequence and publication rules.
9. Check data dates and export results
The bottom status bar identifies the source and completed price date. If it shows a stale-data or coverage note, check the dates before relying on the results.
- Data → Reload saved data
- Read the existing local snapshot and shortlist without contacting FMP. Current filters and search are retained.
- Data → Update from FMP…
- Request a market-data update. Existing results remain usable while the update works through the universe. Cancel returns to the last completed snapshot and retains reusable downloaded packets.
- Data → Data coverage…
- Inspect snapshot coverage and missing-data notes.
- Export CSV
- Export the currently matching rows, including calculation dates and source evidence, for further inspection outside the app.
Market-history updates are manual. Scheduled news collection runs separately at seven daily New York start times. The data sources and snapshot flow section explains how these paths differ.
Current use and availability
Signalbook is currently being used in-house for investment purposes. It is not yet available on app stores.